
Know what works.
Fix what doesn't.
Turn every fill into clear, actionable insights. Upload your broker export and NeoTLog does the rest — every fill matched, every metric calculated.
Your entire trading history, finally readable.
NeoTLog is a web-based trading journal and analytics tool for futures, forex, stock, options and crypto traders. Import your trades once and every chart, metric and calendar day updates automatically — so you can see what's actually working and cut what isn't.
Drop in a broker export and every fill is matched into trades — then the dashboard, calendar, each trade's excursions, the reports and an AI review are ready.
The video and screenshots show a demo account with generated sample trades, not real trading results. Trading involves substantial risk of loss — see the disclosures.
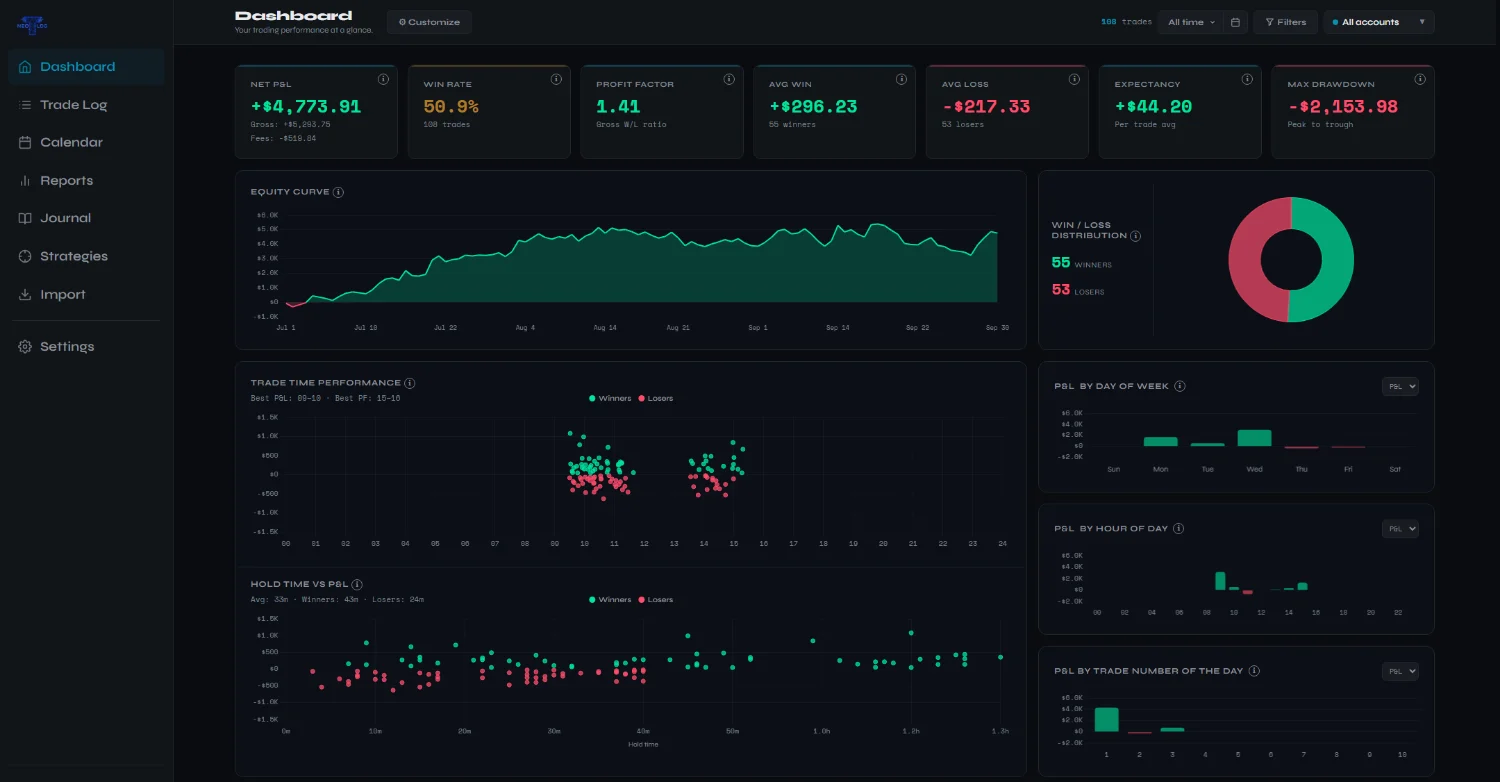
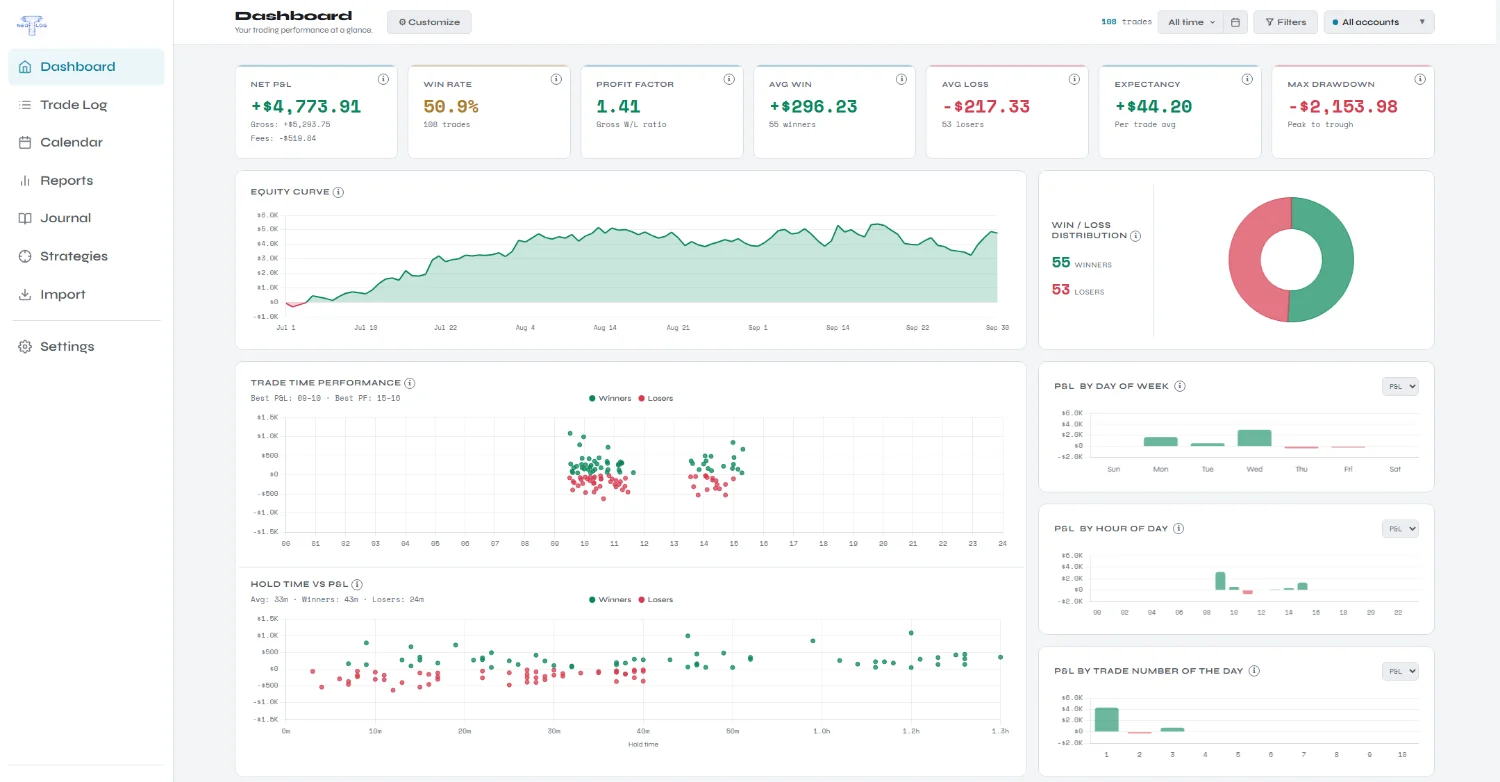
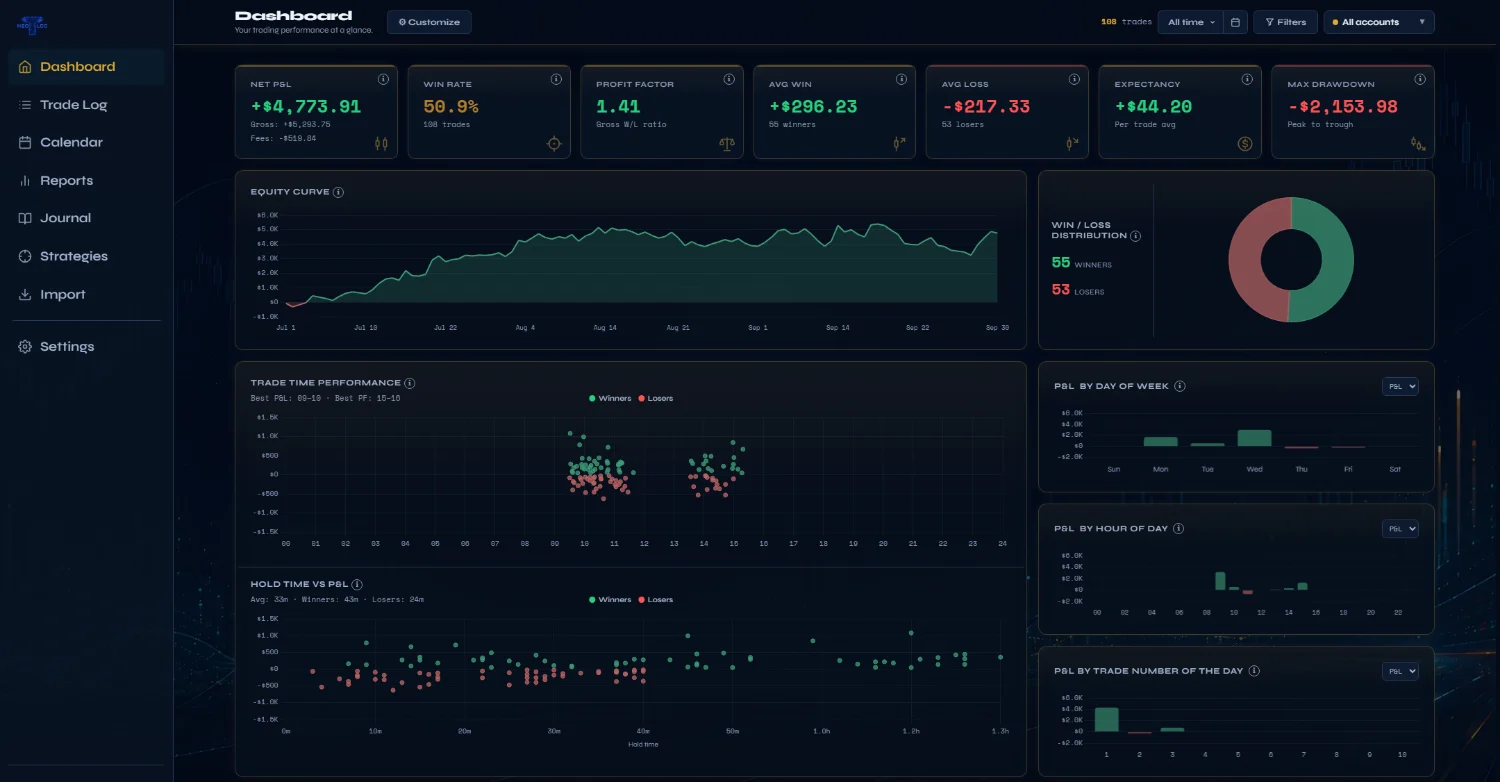
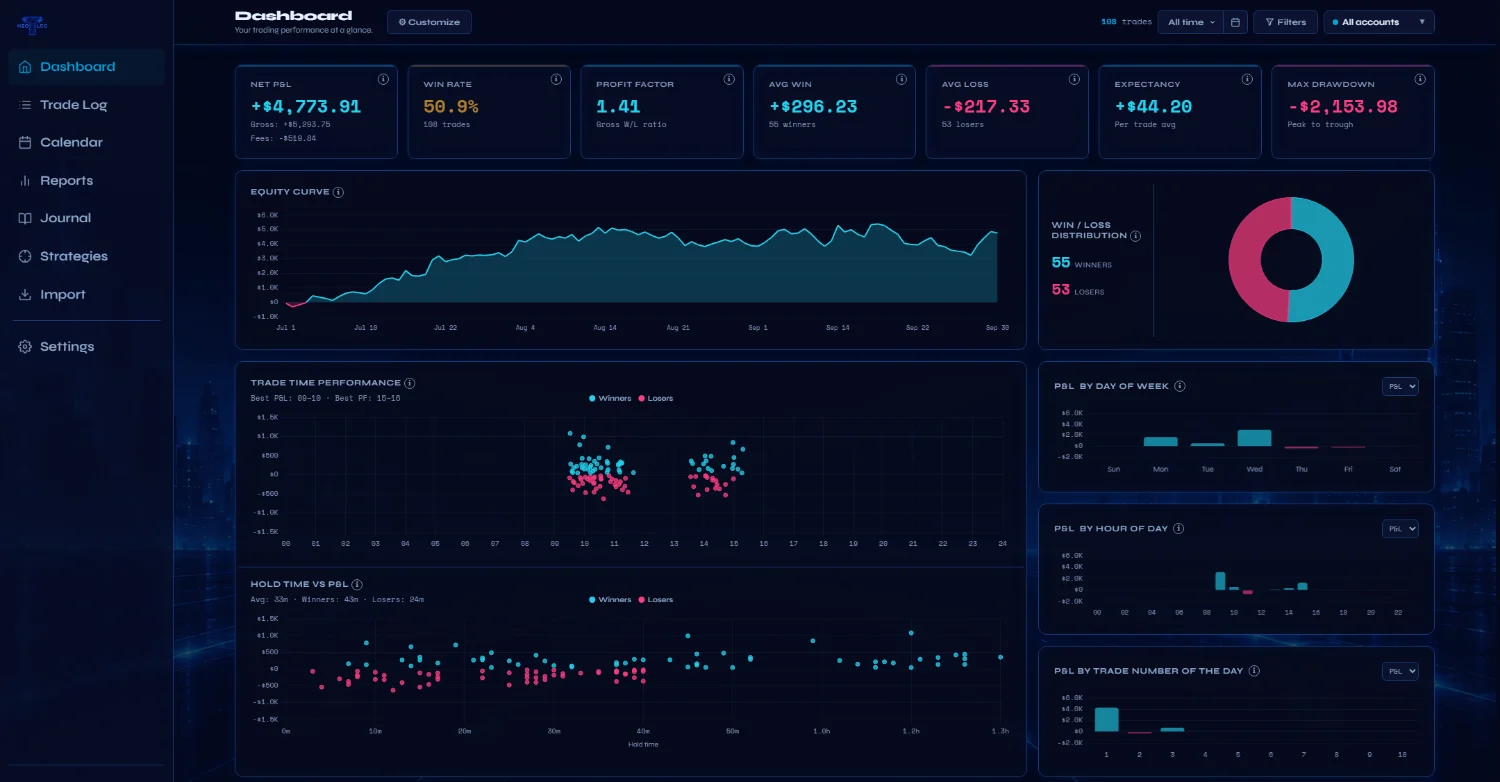
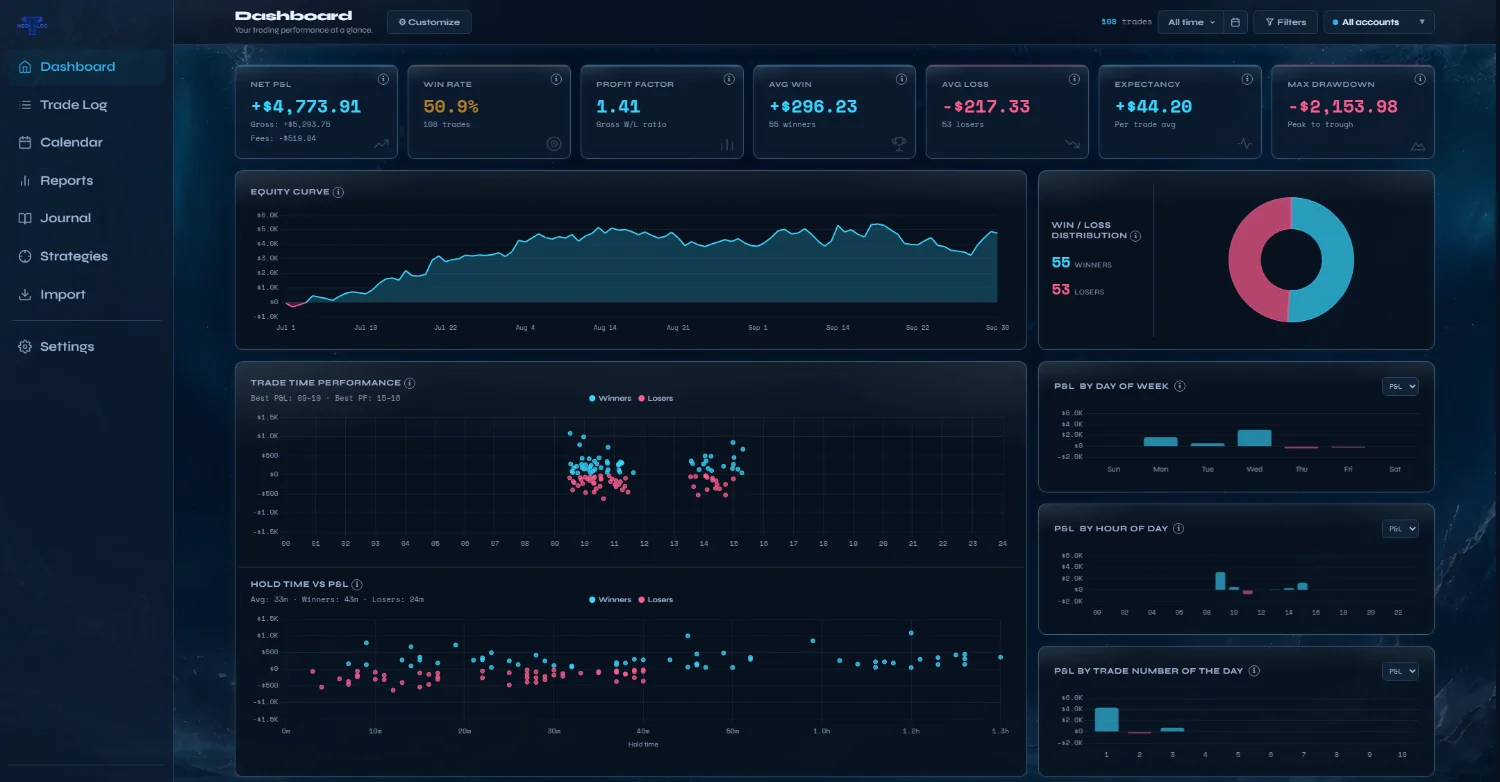
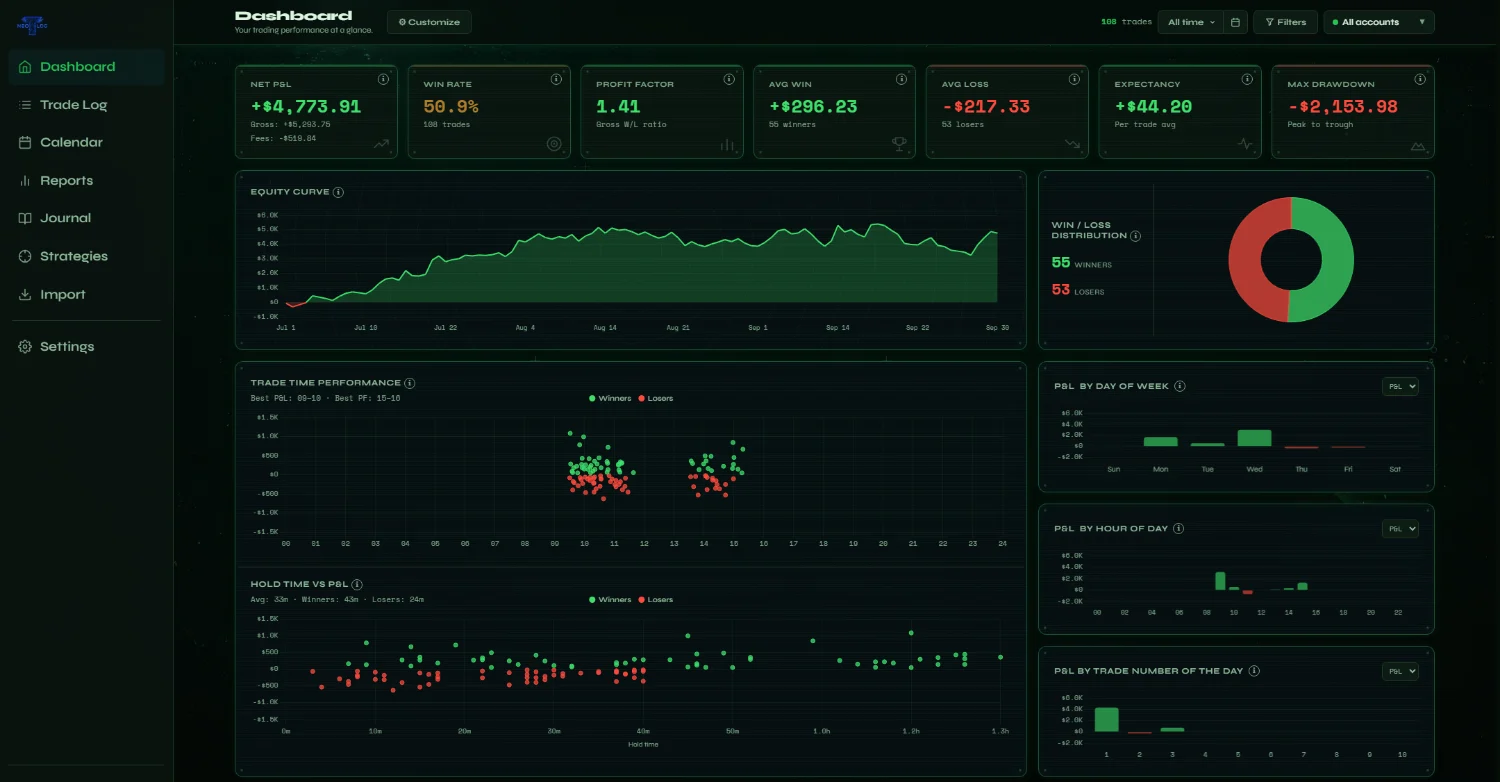
A performance dashboard that turns raw fills into win rate, profit factor, expectancy, equity curve and drawdown — at a glance. Scroll to preview every theme.
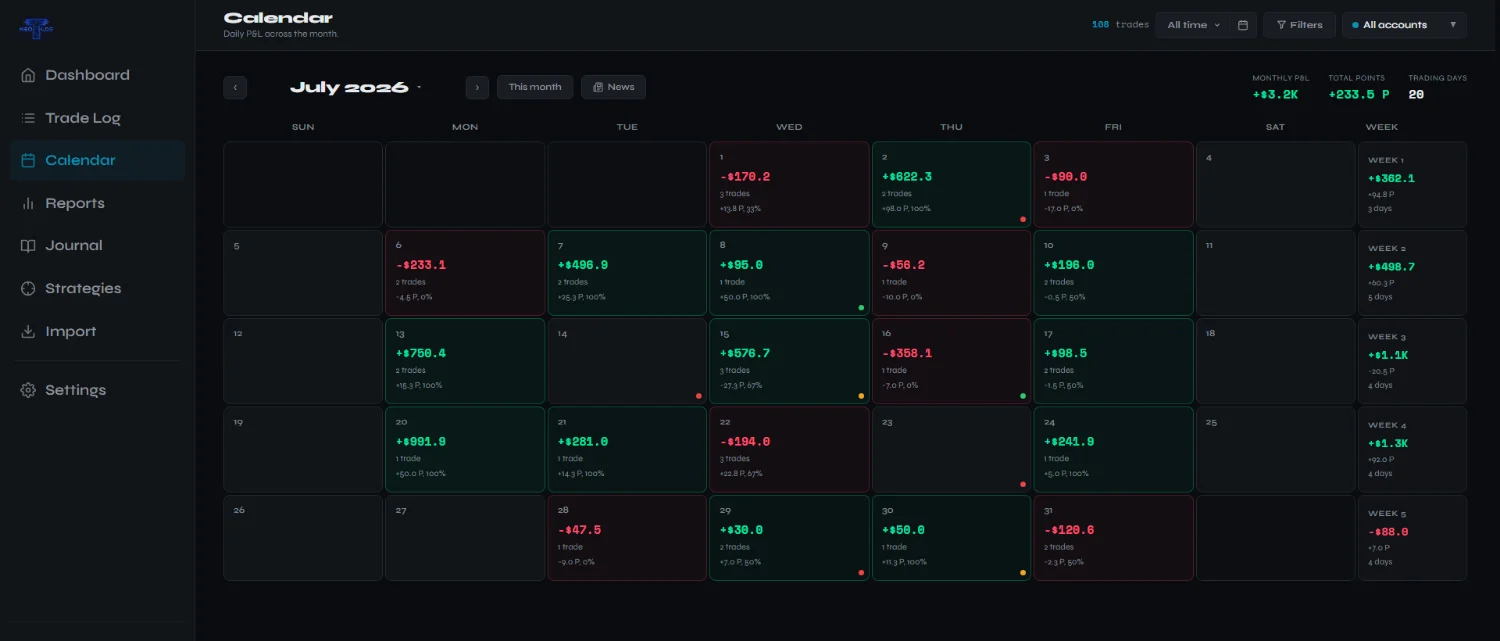
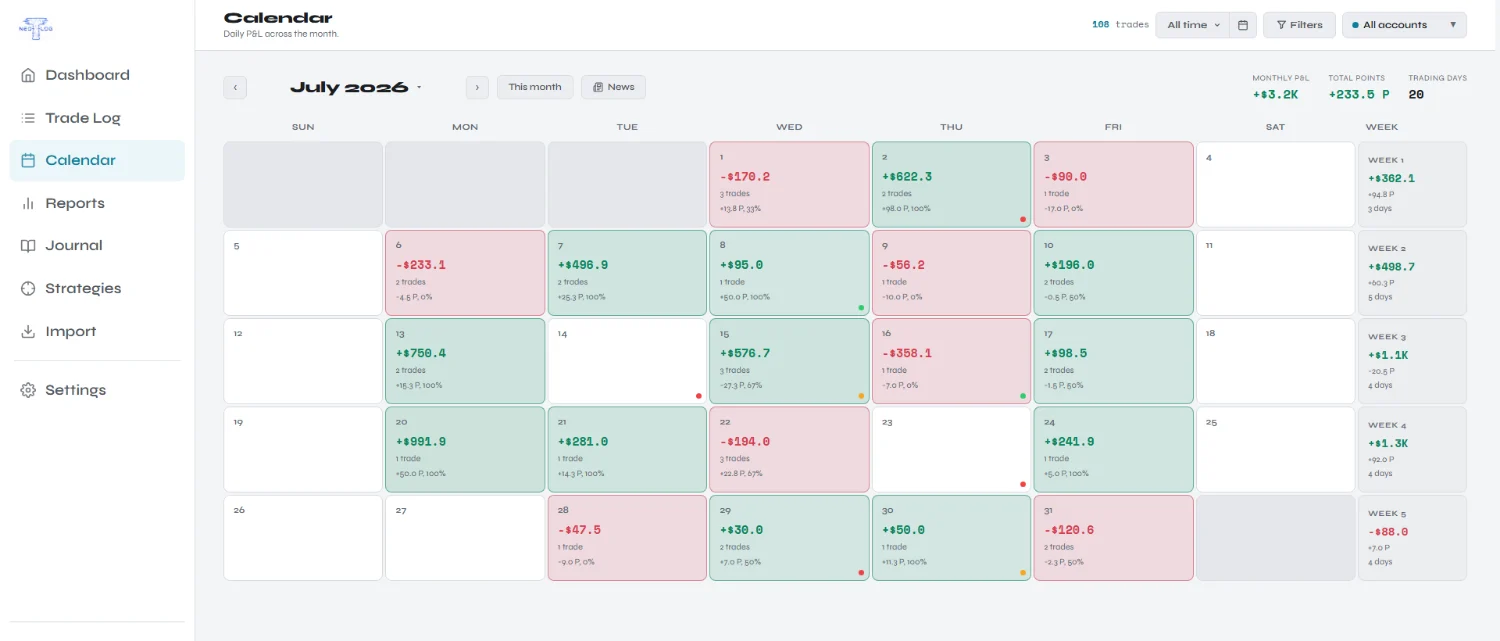
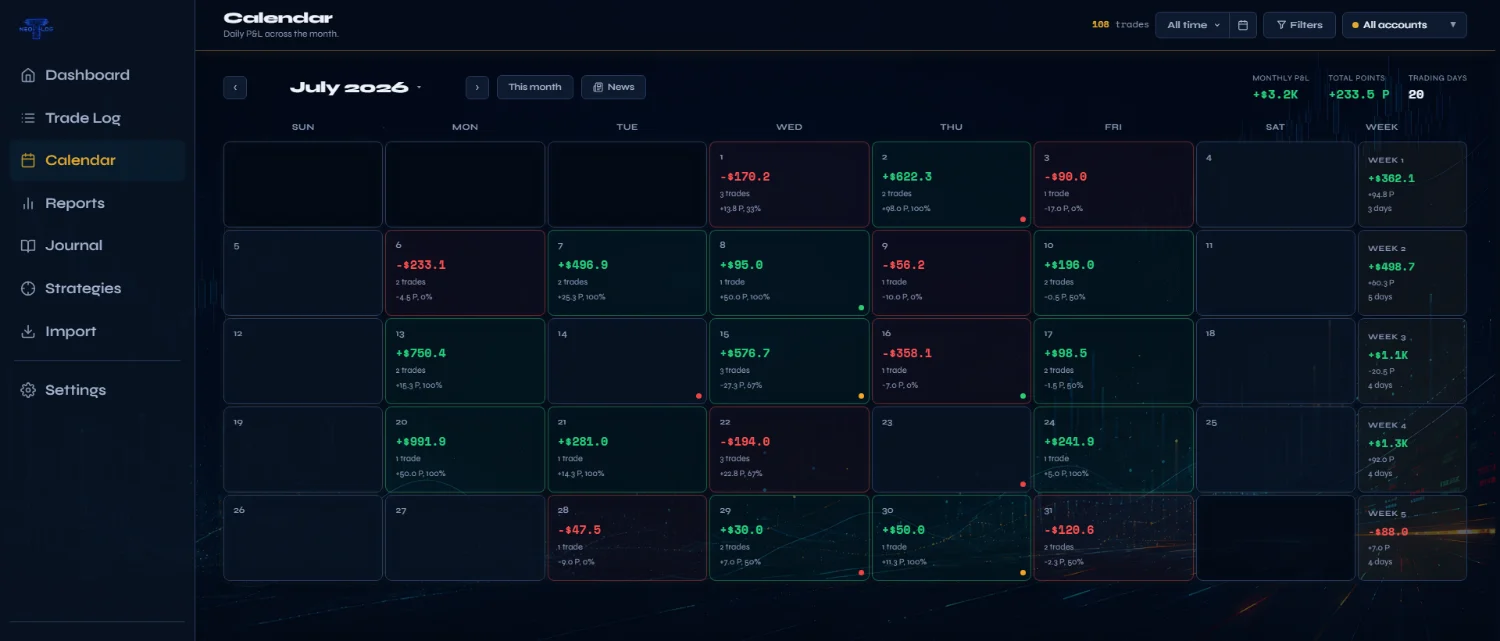
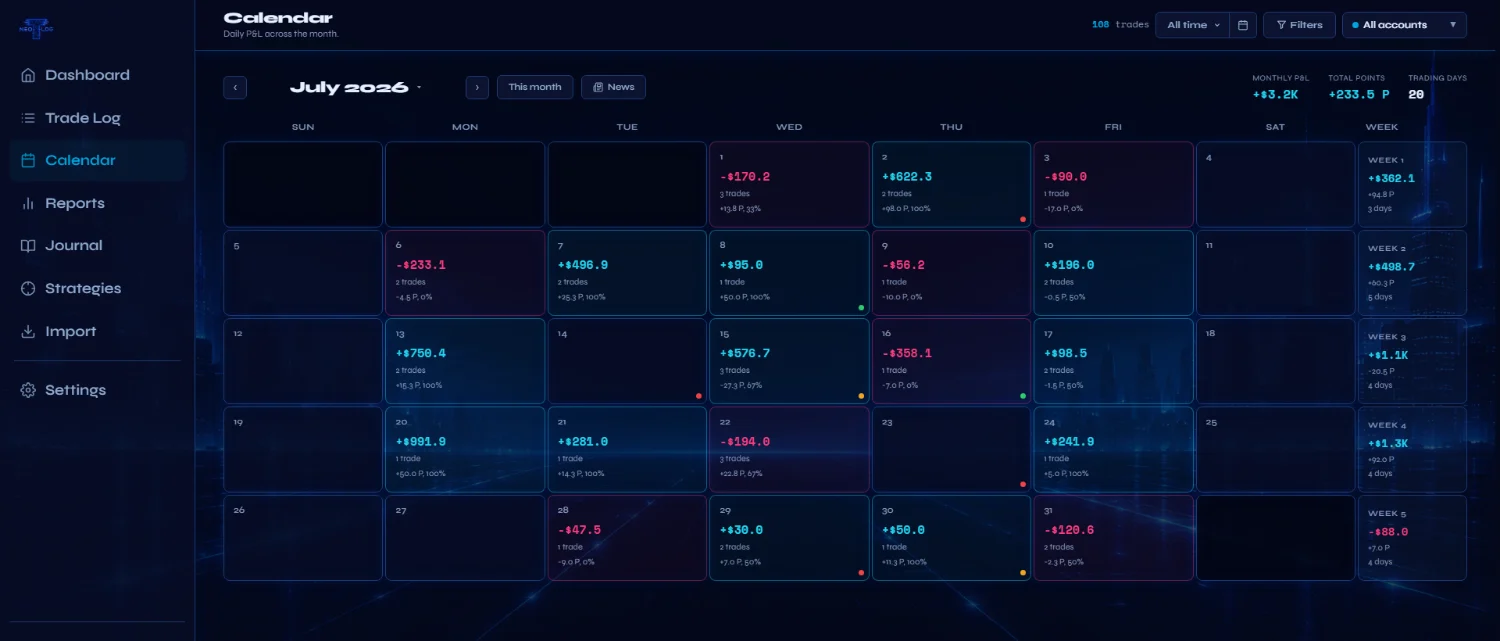
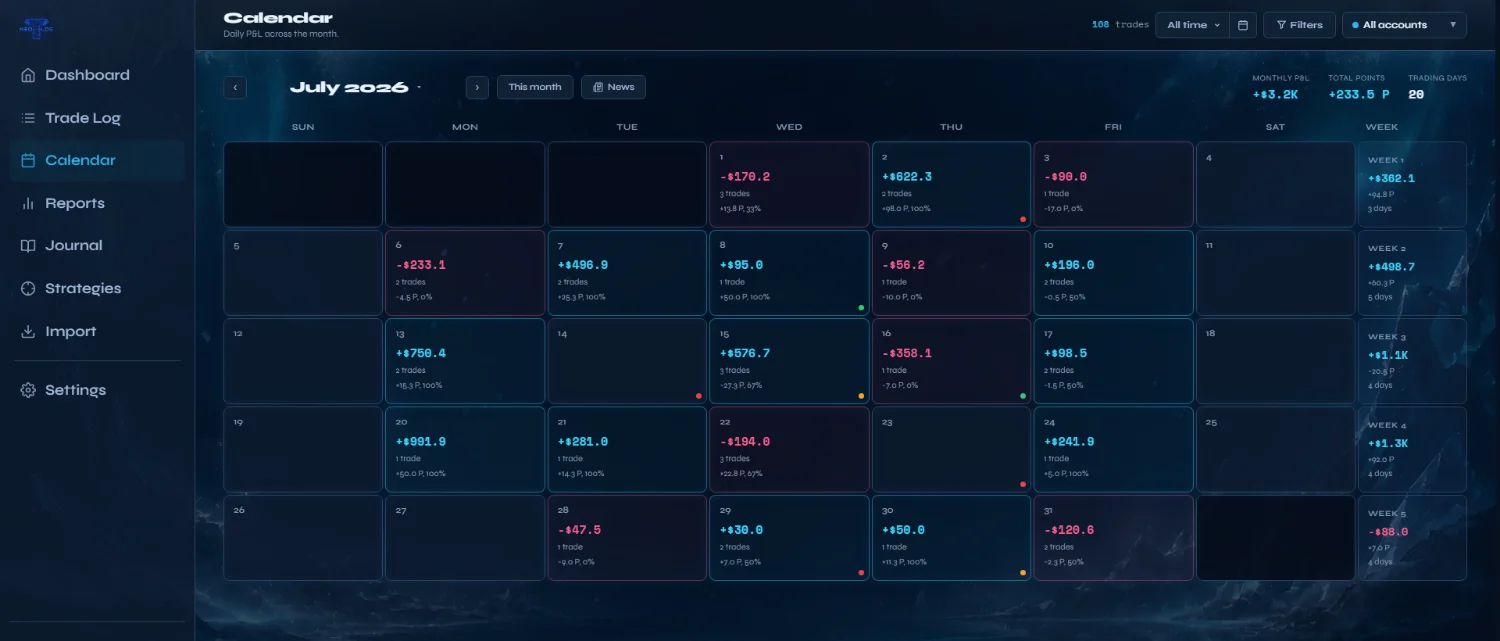
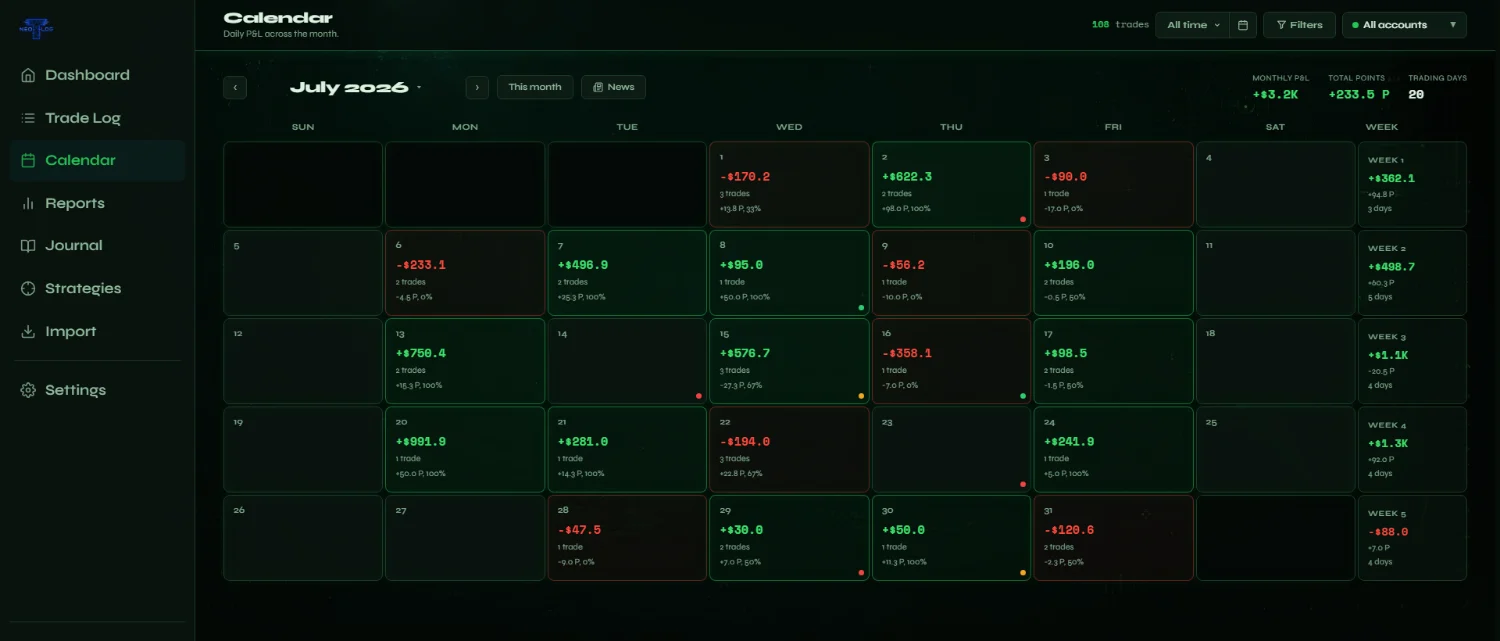
A P&L calendar that maps your profit and loss across every day and week, so patterns jump out instantly.
Three steps to a complete journal.
No copy-pasting from a spreadsheet. NeoTLog reads the export your broker already gives you, matches entries to exits, and calculates the rest.
Import
Export a CSV or Excel file from your broker or platform and upload it. NeoTLog auto-detects the format, pairs your fills into round-trip trades, and applies your commissions and fees.
Analyze
Your dashboard fills in instantly — net P&L, win rate, profit factor, expectancy, max drawdown, equity curve, and performance by day, hour, session and hold time.
Improve
Tag setups, group trades by strategy, and review a P&L calendar to spot what's repeatable. Keep what works, cut the leaks, trade with data instead of memory.
Everything you need to track and improve.
Automated import
Bring trades in from broker CSV/Excel exports across 50+ platforms — futures, forex, stocks, options and crypto. Duplicate fills are skipped automatically.
Performance metrics
Net P&L, win rate, profit factor, expectancy, average win/loss, max drawdown and your longest win/loss streaks — calculated for you.
Equity curve
Watch your account grow (or stall) over time, with a win/loss distribution that shows the balance behind the number.
P&L calendar
Daily and weekly profit and loss laid out as a calendar, so good and bad stretches are obvious at a glance.
Time & session analytics
See P&L by day of week, hour of day, trading session and hold time — and see which windows your results actually come from.
MAE/MFE excursions
See the worst drawdown and best run-up inside every trade — read from broker exports that include it, filled in automatically from market data for crypto, and for US stocks, options, forex and CME futures with your own free Massive key — to sharpen your entries, exits and stops (Plus/Pro).
AI performance reports
A written review of your trading over any period, built from your own stats — strengths, leaks and patterns you might miss, in plain language (Pro).
AI screenshot SL/TP reader
Add a chart screenshot to a trade and the AI reads the stop-loss and take-profit off it — TradingView position tools, MetaTrader order lines and most other charts — so the trade's planned risk and R:R fill in. You check it before anything is saved (Pro, 200 reads a month).
Tags & strategies
Label trades by setup, group them into strategies, and filter your whole history to measure what each approach really earns.
Screenshots & journal
Attach chart screenshots to your trades (Plus and Pro) and write your reasoning in the journal, so a review has the picture and the why — not just the numbers.
Multi-account
Track personal, funded and prop-firm accounts side by side, each colour-coded, with stats per account or combined.
Commissions & fees
Set per-contract or per-execution commissions and fees by account and symbol, so your net P&L reflects real costs.
News days
High-impact economic releases — FOMC, CPI, NFP, PPI and more, plus ECB decisions for forex — are marked on your calendar, and Reports compare your P&L on news days with quiet days, event by event.
Custom themes
Go beyond plain light and dark — Neon electric blue, Frost arctic ice, Sonar deep green and Trader navy & gold, each with optional scenery behind the app (Plus/Pro).
Private by default
Your account is yours alone. Data is stored securely in the EU and never sold — export or delete everything whenever you want.
A spreadsheet can't keep up. NeoTLog can.
Spreadsheets are where most trading journals quietly die — manual, fragile, and silent on the numbers that actually matter. Here's the difference.
- Type in every trade by hand, one row at a time
- Formulas break the moment the layout changes
- You build win rate, profit factor & drawdown yourself
- No equity curve, P&L calendar or session breakdown
- Filtering by setup or time of day is a chore
- Slows to a crawl after a few hundred rows
- Drop in a broker export — trades import themselves
- Nothing to maintain; re-imports skip duplicates
- Win rate, profit factor, expectancy & drawdown, instantly
- Equity curve, P&L calendar & session analytics built in
- Tag, group by strategy and filter your whole history
- Handles thousands of trades across multiple accounts
If it exports a file, NeoTLog can read it.
Import works through the platforms your broker uses — including prop-firm accounts on Apex, Topstep and FTMO via Tradovate and MetaTrader. Don't see yours? Most CSV exports work, and we add formats on request.
Exporting from your platform? There are step-by-step import guides for Tradovate, Rithmic, TopstepX, NinjaTrader, MetaTrader 4 and 5, cTrader, Binance, Bybit, Coinbase and more.
Start free. Upgrade when you outgrow it.
Every plan includes the full dashboard, calendar, analytics and data export. Paid plans lift your annual import limit and unlock unlimited accounts and screenshots. Your imported trades are never deleted if you downgrade — you just can't add new ones past your plan's limit.
- 100 trades annually (imported or entered manually)
- 1 trading account
- Full performance dashboard
- Economic calendar & news days
- P&L calendar & equity curve
- Tags, strategies & sessions
- Commissions & fees engine
- CSV / data export
- Everything in Free
- Unlimited imports
- Unlimited trading accounts
- Attachable screenshots
- Custom themes
- MAE/MFE excursion analytics
- Everything in Plus
- AI reports (20/month)
- Screenshot SL/TP reader (AI)
- Custom dashboard layouts
- Priority support
- Early access to new features
Questions, answered.
What is a trading journal?
A trading journal is a record of every trade you take — entries, exits, size and result — turned into metrics you can learn from. Instead of a manual spreadsheet, NeoTLog imports your trades automatically and calculates win rate, profit factor, expectancy, drawdown and more, so you can find and repeat what works.
Why choose NeoTLog over other trading journals?
NeoTLog offers depth without a high price tag: MAE/MFE excursion analytics, AI performance reports and an AI screenshot reader, on paid plans that cost a fraction of the big names — and a free plan that is genuinely usable. Speed: it's one lightweight app that stays instant with thousands of imported trades. Direction: NeoTLog is independently built and shaped by its users — feature requests go on a public suggestion board and the most-upvoted ideas get built first, so the roadmap is the one traders actually asked for.
How do I import my trades?
Export a CSV or Excel order/trade file from your broker or platform and upload it. NeoTLog detects the format, pairs your fills into round-trip trades, applies your commissions, and updates your dashboard and calendar instantly. Re-importing the same file won't create duplicates.
Which brokers and platforms are supported?
NeoTLog reads exports from 50+ platforms including TradingView, NinjaTrader, Tradovate, ThinkorSwim / Charles Schwab, Webull, Robinhood, Tastytrade, TradeStation, MetaTrader 4 & 5, cTrader, CQG (AMP Futures) and more — covering futures, forex, stocks, options and crypto. Prop-firm accounts on Apex, Topstep and FTMO import via Tradovate and MetaTrader.
Is there a free plan?
Yes. The Free plan lets you add up to 100 trades annually (imported or entered manually) on one account, with the full dashboard, calendar, analytics and CSV export — no credit card required. Upgrade to Plus or Pro when you need more, unlimited accounts or screenshots.
Is my trading data private?
Your data belongs to you. It's stored securely in the EU, isolated per account, and never sold. You can export or permanently delete everything from your settings at any time.
Do you offer automated broker sync?
Not yet. NeoTLog imports through file uploads (CSV/Excel), which works with virtually any broker — re-importing the same file never creates duplicates, and step-by-step import guides cover the most common platforms. If automatic sync with your platform matters to you, say so on the suggestion board: the most-upvoted requests get built first.
How can I support NeoTLog?
Three ways, all appreciated. Tell another trader — word of mouth is a great way to help us grow our user base and reach out to more traders. Vote and post on the public suggestion board — the most-upvoted ideas get built first, your ideas and votes help us improve and develop our service with your needs in mind. NeoTLog is independently built and maintained, so if the journal earns a place in your routine, upgrading to a paid plan is the most direct way to support its development.
Start your journal today.
Import your first trades in seconds — it's free to start.
Sign up for free →